
By Dr. Thomas Burnell and Dr. Bethany Turner
Next Lesson - Cardiovascular Drugs
Core
This article is split into different sections:
- Arrhythmias
- Heart block
- Ischaemia and injury
- Electrolyte disturbances
- Afterdepolarisations
Many arrhythmias originate outside of the normal conduction system of the heart, arising from ectopic foci in the atria or ventricles. However, some arrhythmias originate within the normal conduction system, such as sinus tachycardia or sinus bradycardia from the sinoatrial node.
An easy rule to help determine where a rhythm is originating from is to look at the width of the QRS complex. If it is narrow, this usually suggests that the rhythm is originating above the ventricles and travelling via the normal conduction pathway. If the QRS is broad, this often suggests a ventricular origin or abnormal ventricular conduction, although this rule is not absolute.
There are two common ways that an abnormal rhythm can start to cause an arrhythmia. This can be because of an ectopic focus, or a re-entry loop.
Ectopic beats can lead to tachycardic rhythms, and while some may be benign, others can indicate underlying cardiac issues that require further evaluation. These are impulses that are generated by an area (focus) in the myocardium, not the sinoatrial (SA) node. Ectopic impulses can be generated by a small area of highly excitable myocardium which can spontaneously depolarise and cause a wave of depolarisation.
The features seen on an ECG depend on where the ectopic impulse originates:
- Atrial ectopics - an abnormally shaped P wave that appears early and is usually followed by a QRS complex due to the impulse being conducted to the ventricles. Atrial ectopic beats can trigger atrial fibrillation, which is sustained by interacting focal and re-entrant mechanisms.
- Atrioventricular (AV) junctional ectopics - these ectopics can activate the ventricles by travelling via the His-Purkinje system, therefore giving a normal QRS. Impulses can also retrogradely activate the atria (the impulse travels backwards from the AV node to spread across the atria) to give an inverted P wave, however this can be masked by the QRS complex as the two events happen at the same time.
- Ventricular ectopics - premature impulses can arise in ventricular myocardium or Purkinje cells. They usually produce a broad QRS because ventricular activation differs from the normal rapid, coordinated His-Purkinje sequence and includes slower spread through myocardium. Purkinje origin or involvement is therefore possible. A compensatory pause is common when the sinus node is not reset and the next sinus impulse reaches refractory ventricles, but a pause is not obligatory.
In the conduction system of the myocardium, there are areas in the pathway where electrical impulses can split and travel down two paths. This usually isn't a problem because when the two impulses meet each other again, they cancel each other out. This allows the myocardium to contract in an even and efficient way.
However, problems arise when there is damage to areas of myocardium that disrupt the normal pathway of electrical impulses, or there are structural abnormalities. In the case of re-entry loops, there is an area of myocardium that is damaged and causes a unidirectional conduction block (electrical impulses can only travel one way through the damaged tissue, and one direction is blocked). Therefore electrical impulses will be able to retrogradely travel through the damaged tissue.
The impulse in a re-entry loop will travel back on itself and take alternative routes through the myocardium, causing abnormal contraction of the heart. This is best shown in the diagram below.
If there are re-entry loops, patients can have:
- AV nodal re-entry - if there are 'fast' and 'slow' pathways in the AV node, there can be a re-entry loop which can cause a supraventricular tachycardia.
- Atrioventricular re-entry - an accessory pathway between atria and ventricles leads to a re-entry loop. E.g. Wolff-Parkinson-White syndrome.
- Atrial flutter can be caused by a re-entry loop in the atria.
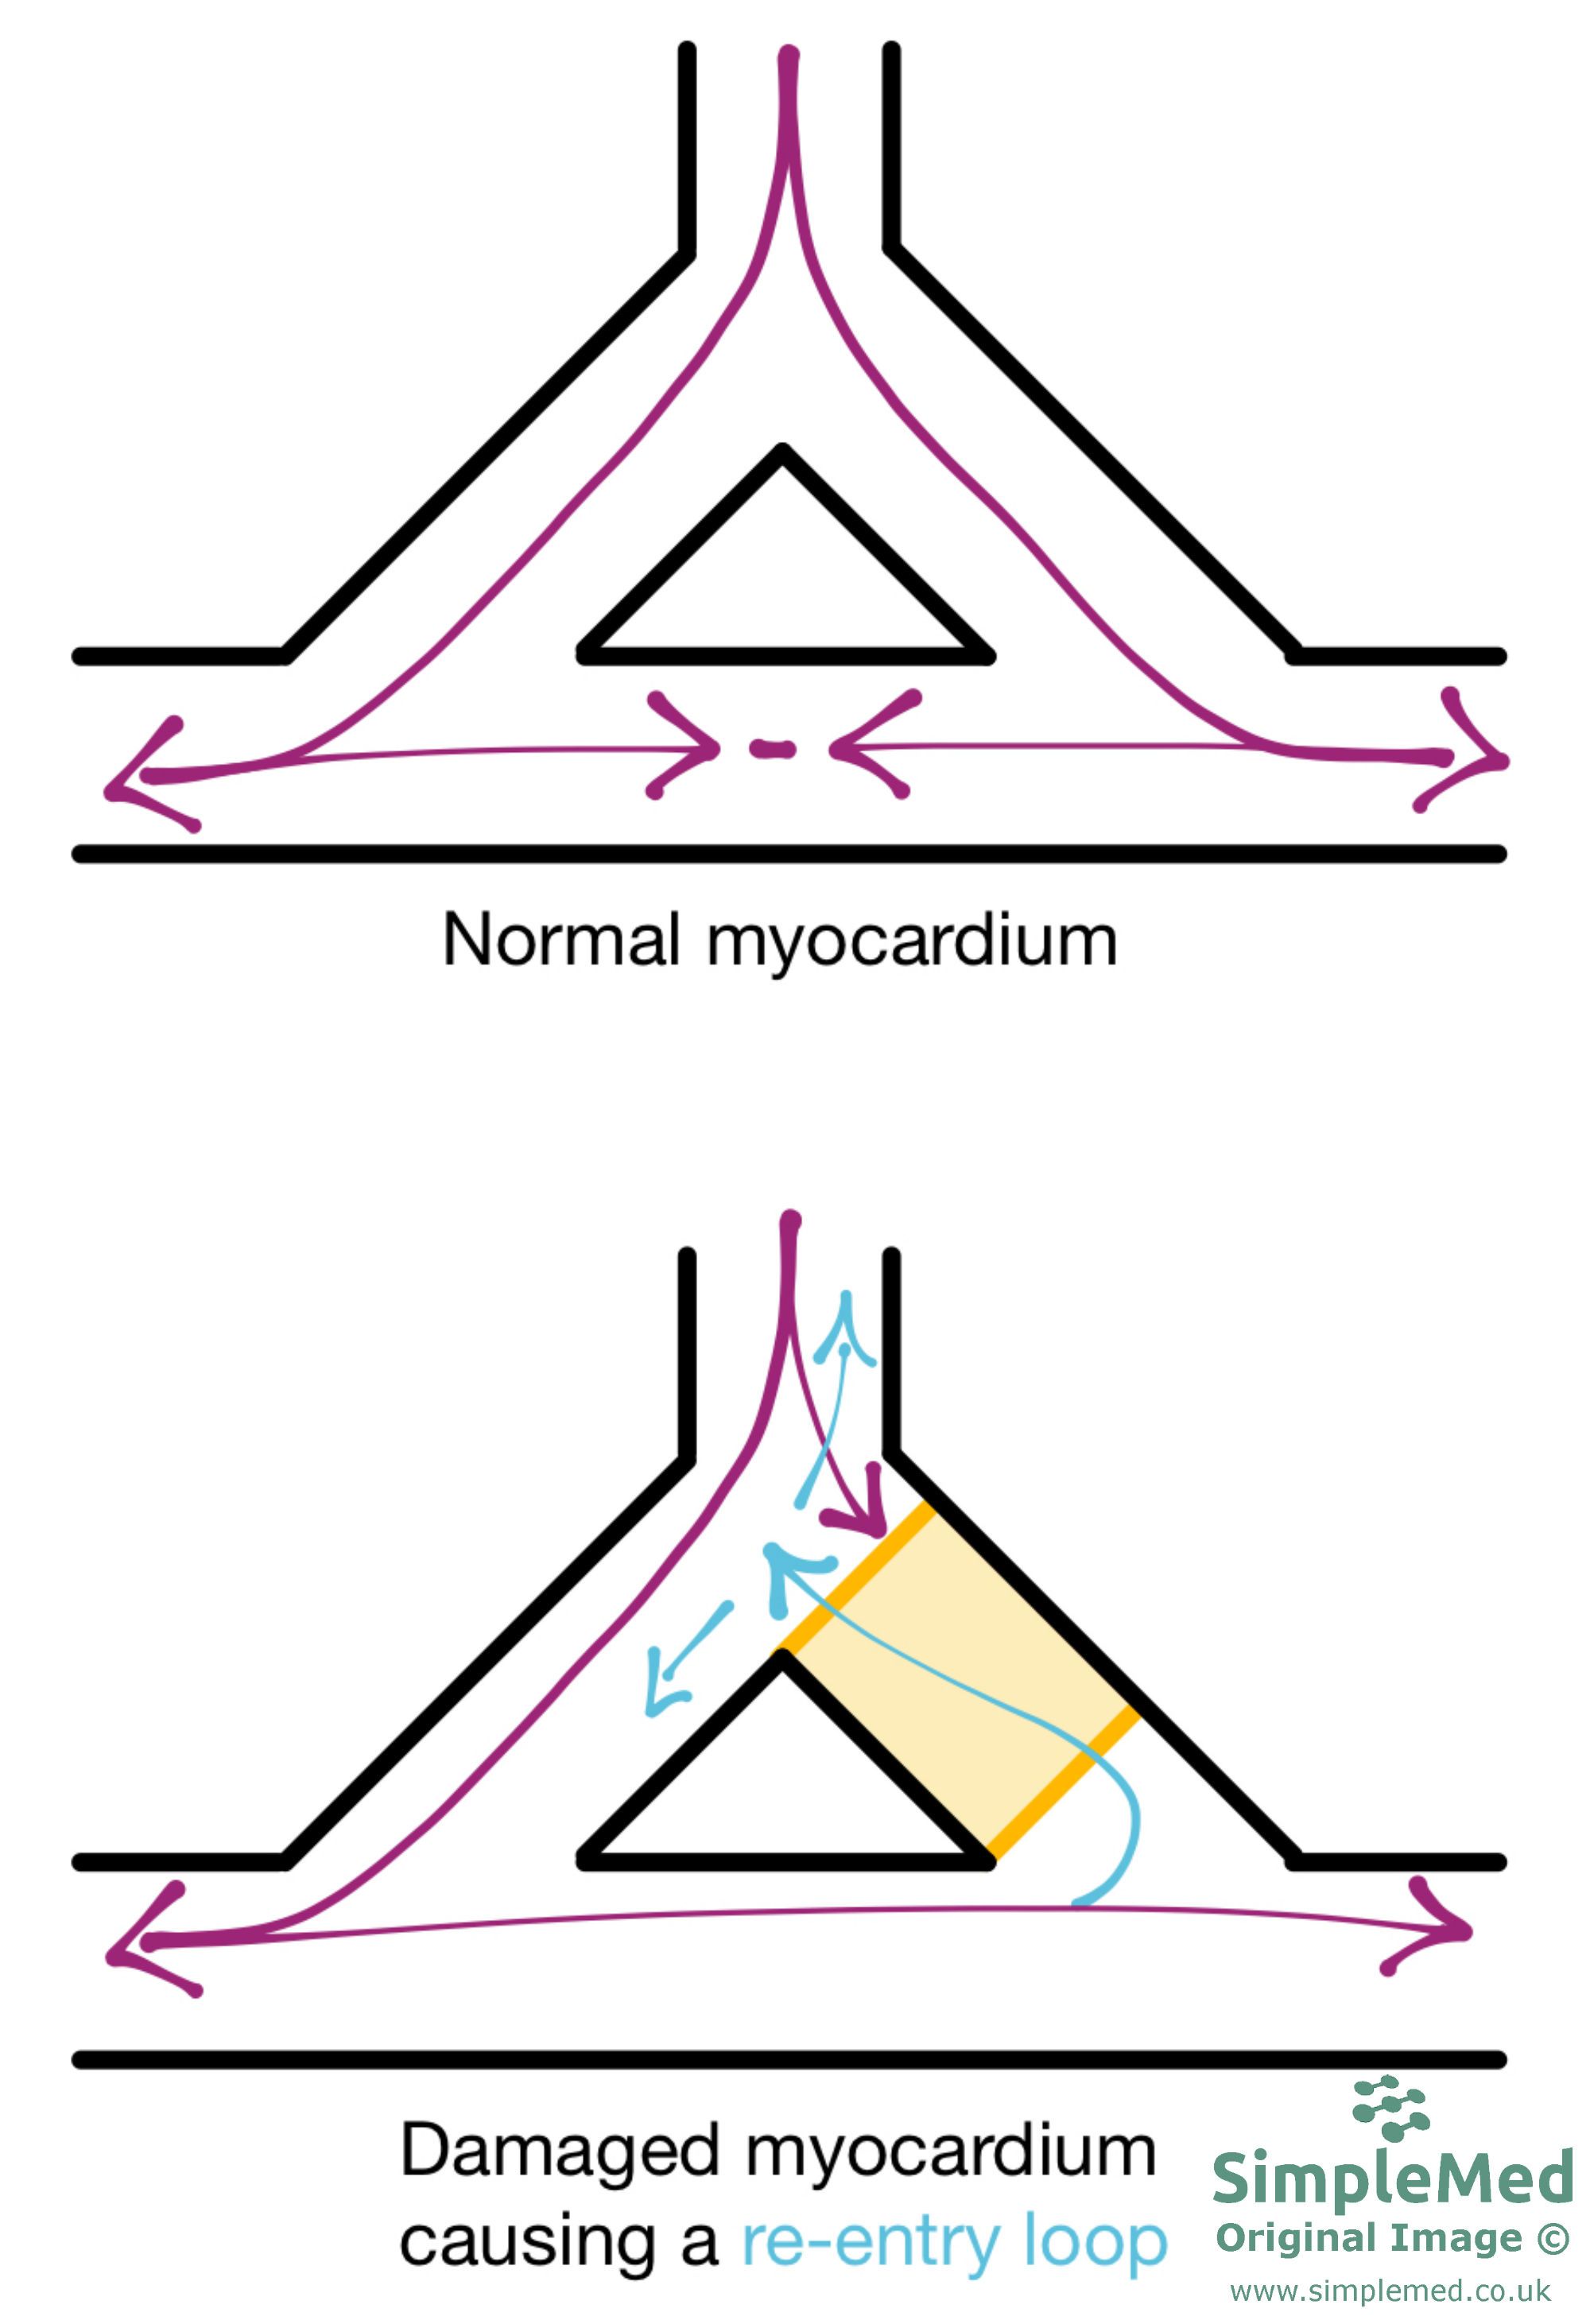
Diagram - Compares the pathways of electrical impulses in normal and damaged myocardium. Note how in the damaged myocardium, the impulse cannot travel down the right limb (purple arrow) due to damage, however, it can travel up the right limb (blue arrow). This is a unidirectional block of conduction. The impulse shown by the blue arrow can now spread across the myocardium causing contraction
SimpleMed original by Dr. Bethany Turner
In atrial tachycardia the heart rate is above 100 bpm. At faster rates, P waves may become difficult to identify on the ECG and can be obscured by preceding T waves. Atrial tachycardia is usually caused by an ectopic focus within the atrial myocardium. This is distinct from AV nodal re-entry tachycardia, which is due to a re-entry circuit involving the AV node and is classified separately as a supraventricular tachycardia.
Causes include digoxin toxicity, ischaemic heart disease, rheumatic heart disease.
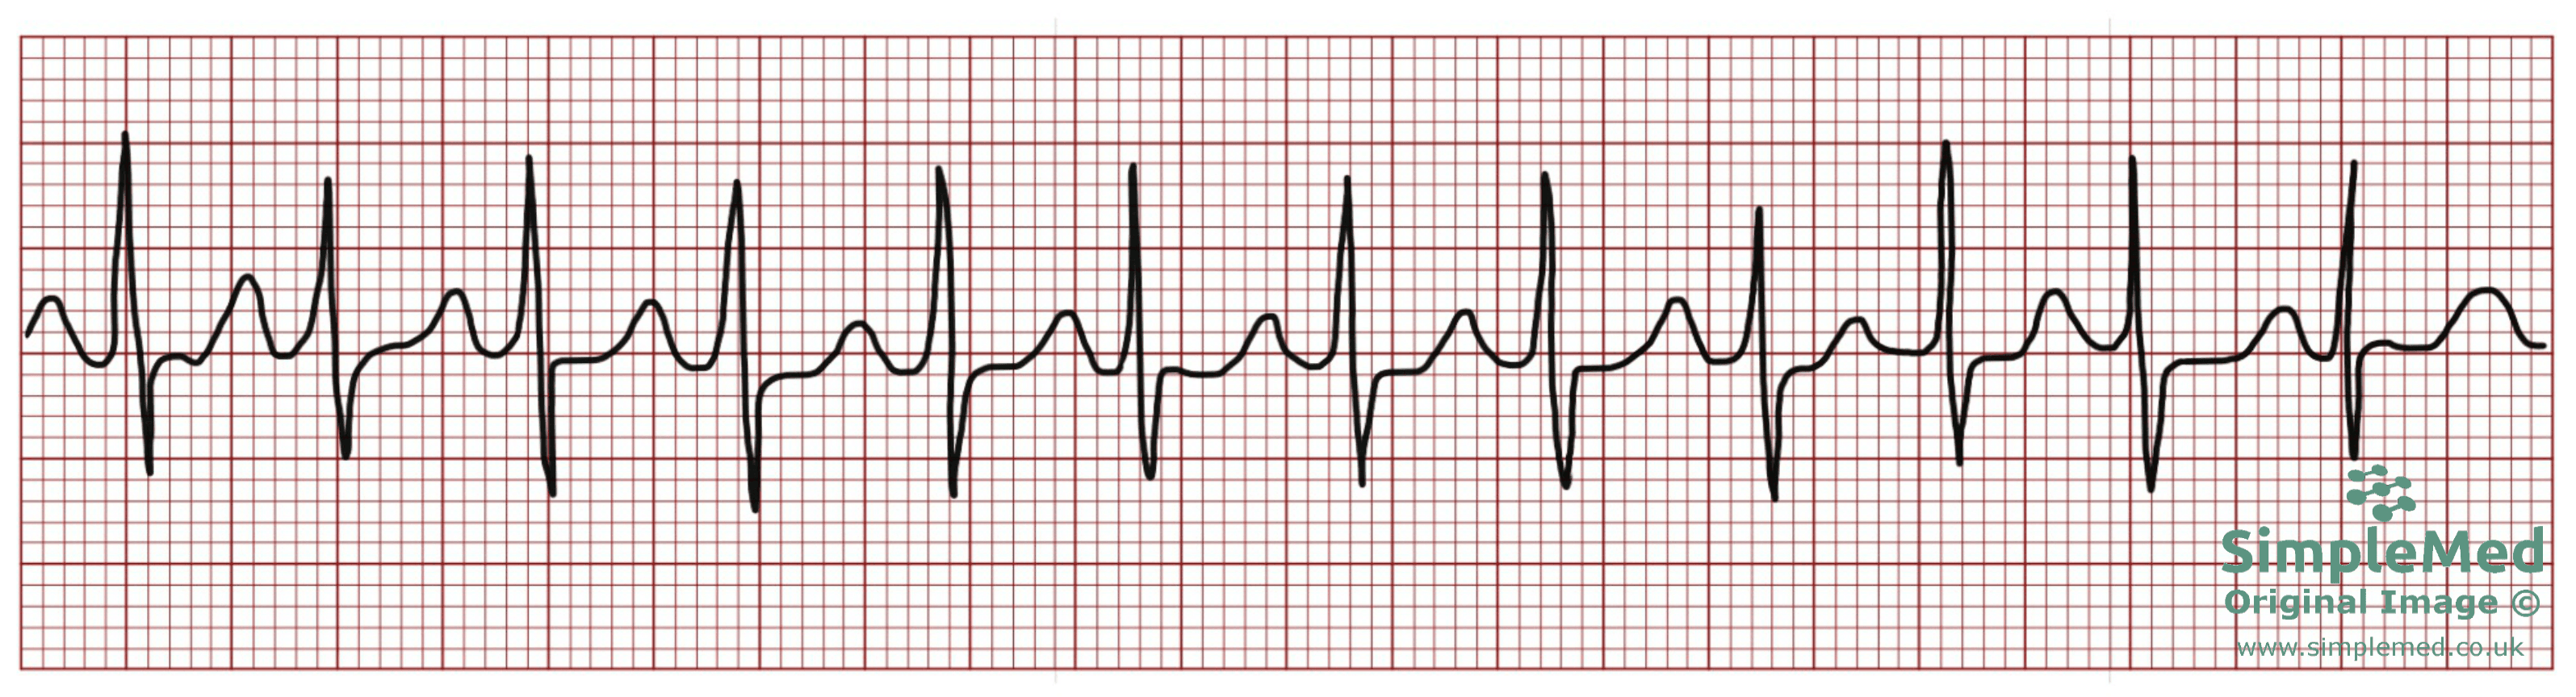
Diagram - Atrial Tachycardia on an ECG. The P and T waves occur at the same time and have merged to form one wave
SimpleMed original by Dr. Bethany Turner
Atrial flutter is caused by a re-entry loop in the atria.
The AV node usually conducts only some of the rapid atrial impulses in flutter. There is no fixed upper limit of 200 bpm: conduction depends on refractoriness, autonomic tone and medicines, and 1:1 conduction can occur. A common pattern is 2:1 conduction, with two atrial flutter waves for each ventricular QRS complex; other fixed ratios or variable conduction are possible. Flutter waves can produce a sawtooth baseline on the ECG.
The re-entry loop sends off impulses at around 300bpm, making the most common heart rate 150bpm.
Causes include: hypertension, ischaemic heart disease, hyperthyroidism, alcoholism, cardiomyopathy.
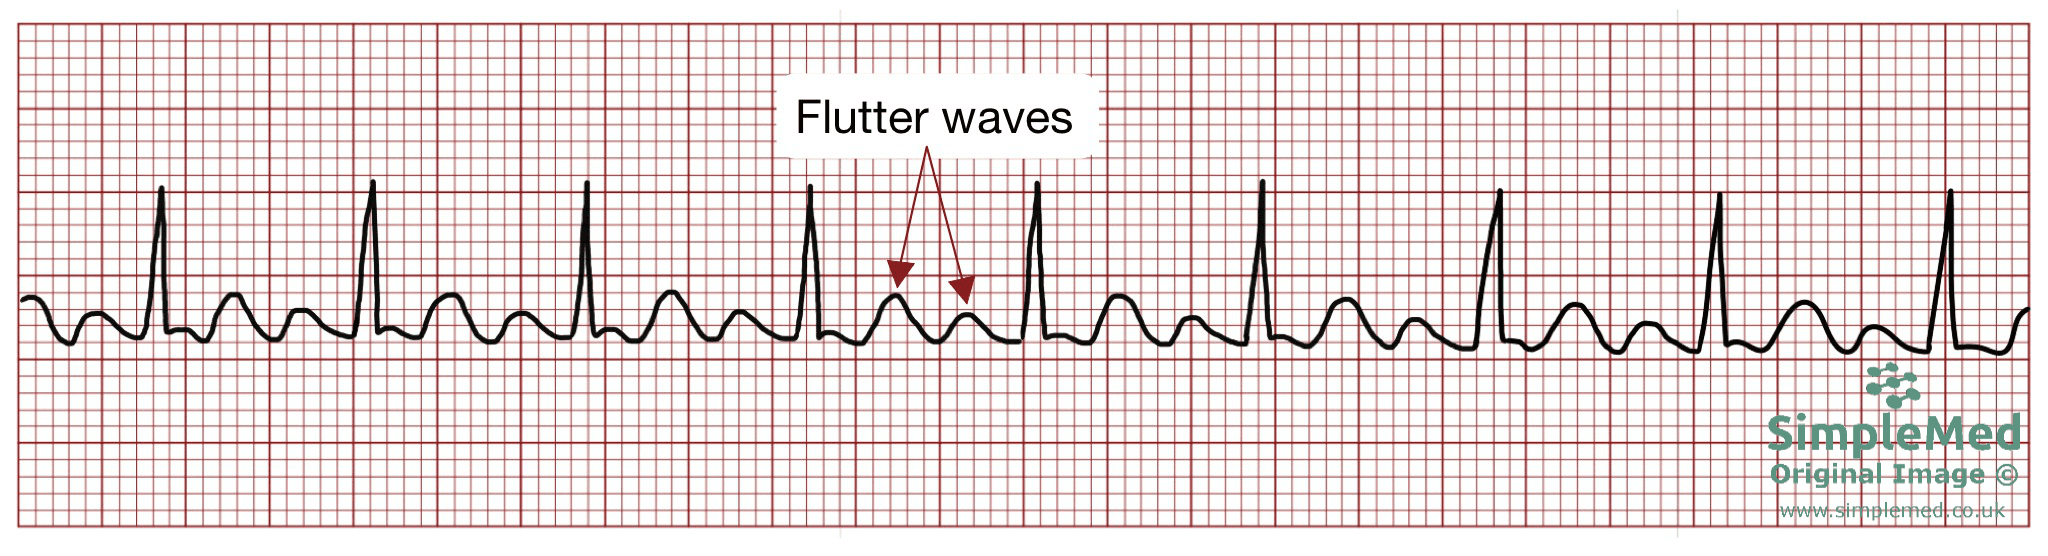
Diagram - Atrial Flutter on an ECG. Note how there are 2 flutter waves for every QRS complex
SimpleMed original by Dr. Bethany Turner
AF is initiated and maintained by interacting focal and re-entrant mechanisms. Triggers often arise near the pulmonary veins, while electrical and structural remodelling of the atria helps sustain disorganised activation. Coordinated atrial contraction is lost and the atria quiver.
The AV node conducts atrial impulses inconsistently because of its refractory behaviour, usually producing irregular R-R intervals. QRS complexes are generally narrow when ventricular conduction is otherwise normal. Bundle branch block, rate-related aberrancy or pre-excitation can produce broad complexes, so a normal QRS width is not required for AF.
The pulse is usually irregularly irregular. The ventricular rate may be fast, within the usual resting range or slow, depending on AV conduction and treatment; a rate above 100 bpm is not required for AF. Pulse strength may vary as changing filling intervals alter stroke volume, and some ventricular beats may not produce a palpable peripheral pulse.
In AF, the quivering atria essentially cause stasis of blood as the atria are less efficient at pumping blood into the ventricles. This can result in thrombus formation. A thrombus in the left atrium is more common as blood can sit in the left auricle and clot, which can easily embolise and cause an ischaemic stroke.
Causes include: dilated left atrium, hypertension, ischaemic heart disease, hyperthyroidism, alcohol, cardiomyopathy.
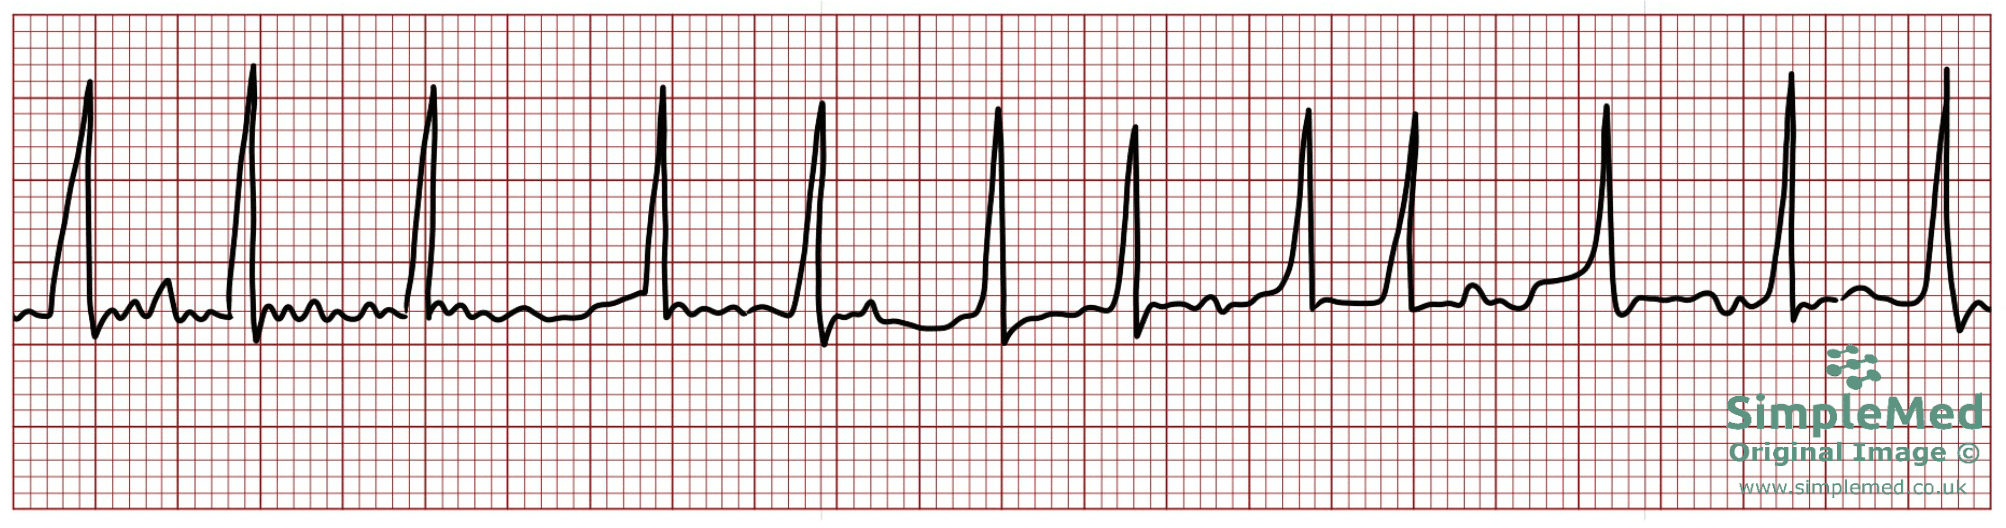
Diagram - Atrial Fibrillation on an ECG. Note the wavy baseline and irregular R-R intervals
SimpleMed original by Dr. Bethany Turner
Ventricular tachycardia is caused by an ectopic focus in the ventricular myocardium. VT is identified as three or more consecutive ventricular ectopic beats - these are seen as very broad and bizarre QRS complexes on the ECG. VT is a dangerous rhythm as it can degenerate into ventricular fibrillation.
Causes include: myocardial infarction, ischaemic heart disease, hypertrophic/dilated cardiomyopathy.
In ventricular fibrillation there is chaotic ventricular depolarisation caused by impulses from numerous ectopic foci in the ventricles. As a result, there is no co-ordinated contraction of the ventricles and atria. This results in severely reduced cardiac output, and the patient will go into cardiac arrest.
VF is commonly associated with myocardial infarction, but can also be as a result of Torsades de Pointes (discussed next).
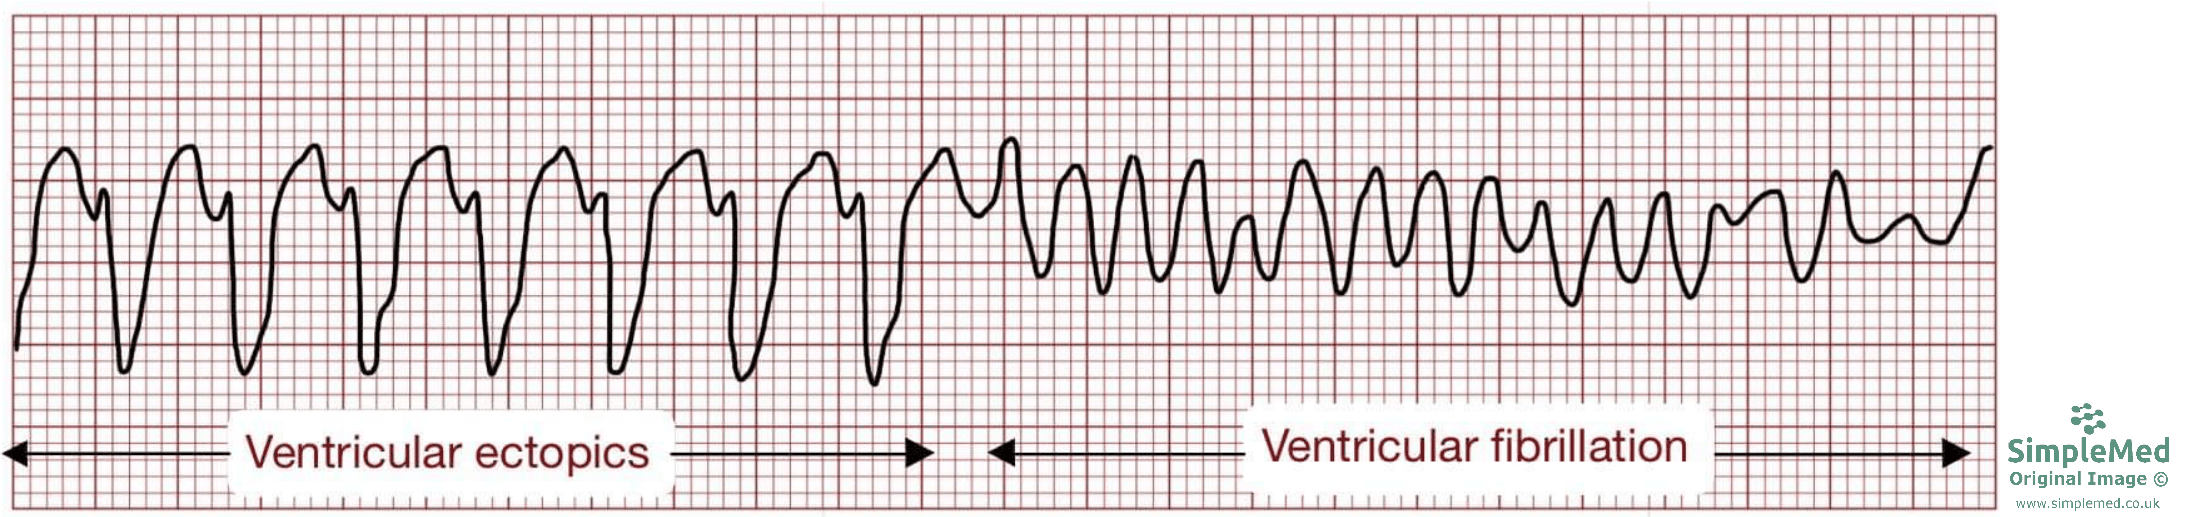
Diagram - Ventricular tachycardia degenerating into ventricular fibrillation. The left hand side shows ventricular tachycardia. Note the wide QRS complexes of the ectopic beats, and the fact there are more than 3 in a row. The right hand side shows ventricular fibrillation. Note the chaotic trace with no normal ECG features
SimpleMed original by Dr. Bethany Turner
Torsades de pointes is a polymorphic ventricular tachycardia. This means that there is a rapid ventricular rhythm in which the QRS complexes vary in shape and axis.
Causes include: anti-arrhythmic drug treatment and electrolyte abnormalities which cause a long QT interval. Patients can also have a long QT interval with no identifiable cause.
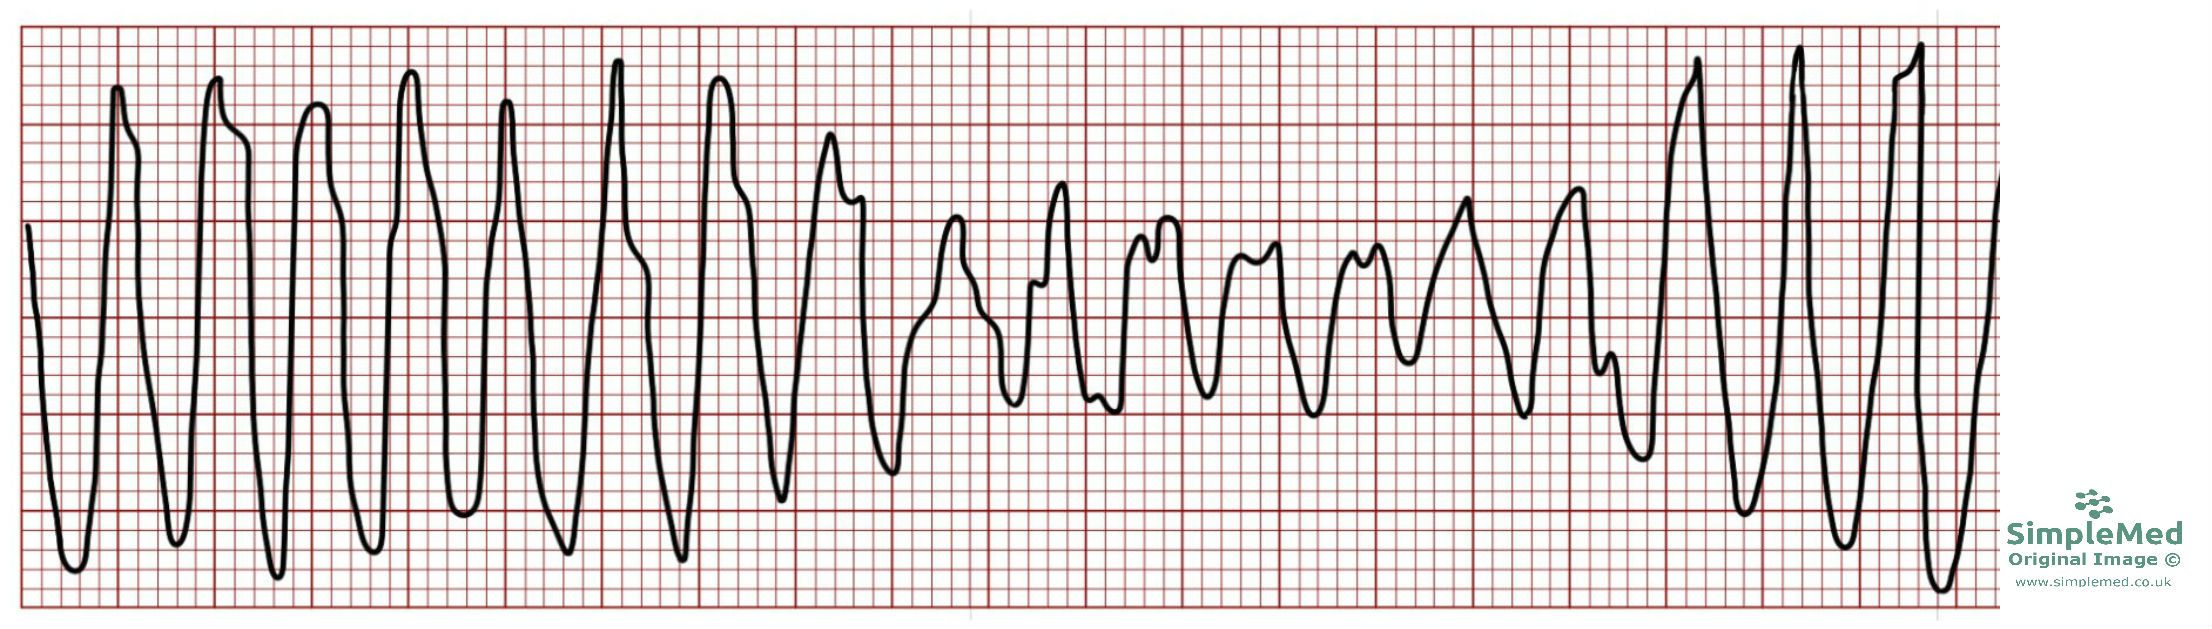
Diagram - Torsades de Pointes on an ECG
SimpleMed original by Dr. Bethany Turner
First degree AV block is caused by delayed conduction through the AV node resulting in a consistently prolonged PR interval. The PR interval is >5 small boxes. First degree AV block can develop into second or third degree.
Causes include ischaemic heart disease, increased vagal tone and AV nodal blocking drugs such as beta blockers.
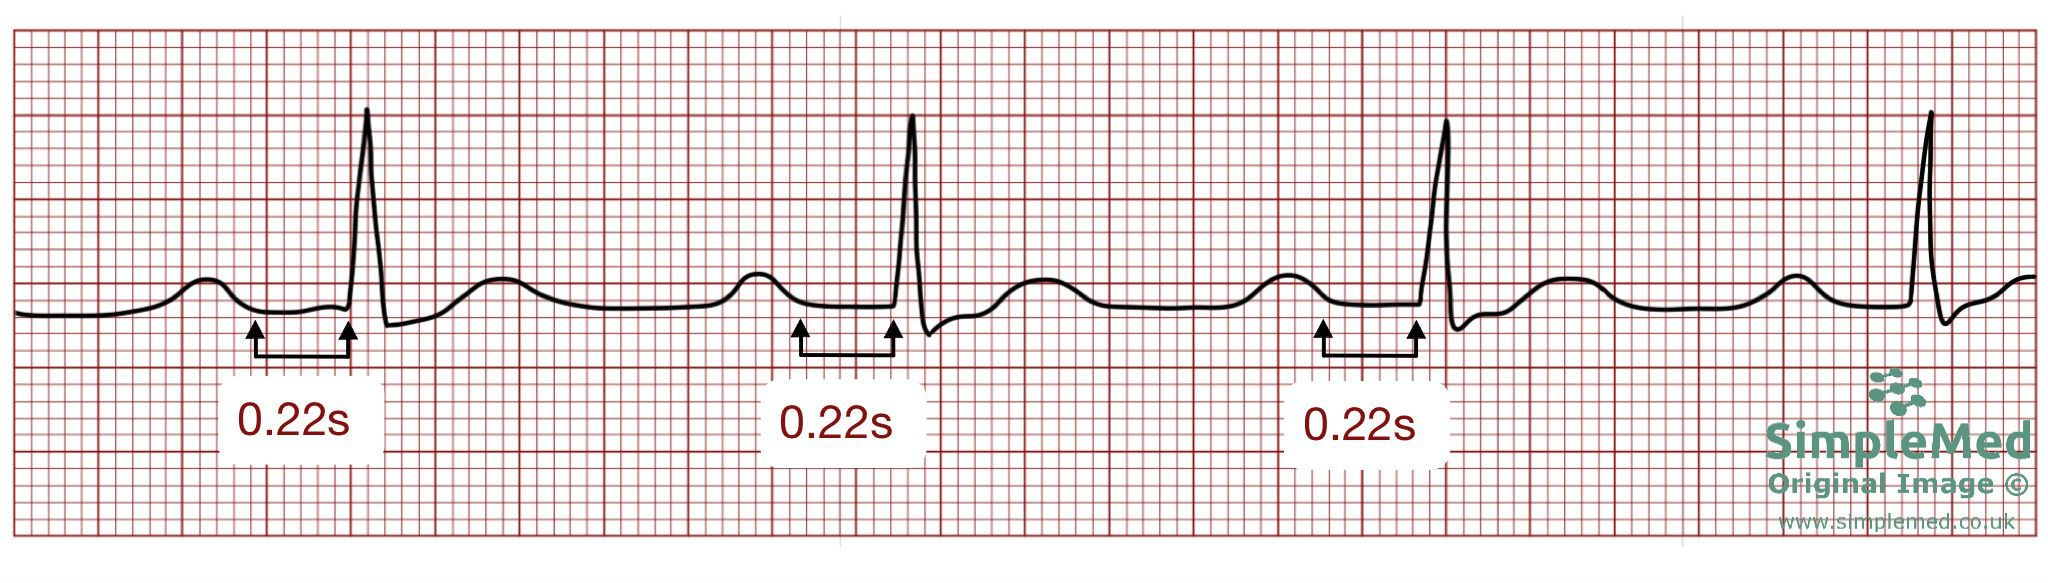
Diagram - First Degree AV Block on an ECG. Note the lengthened but constant distance between the P wave and QRS complex
SimpleMed original by Dr. Bethany Turner
There are two types of second degree AV block: Mobitz type I and Mobitz type II.
- Mobitz type I - the PR interval becomes progressively longer until one of the QRS complexes is dropped. The PR interval then returns to normal and repeats the cycle.
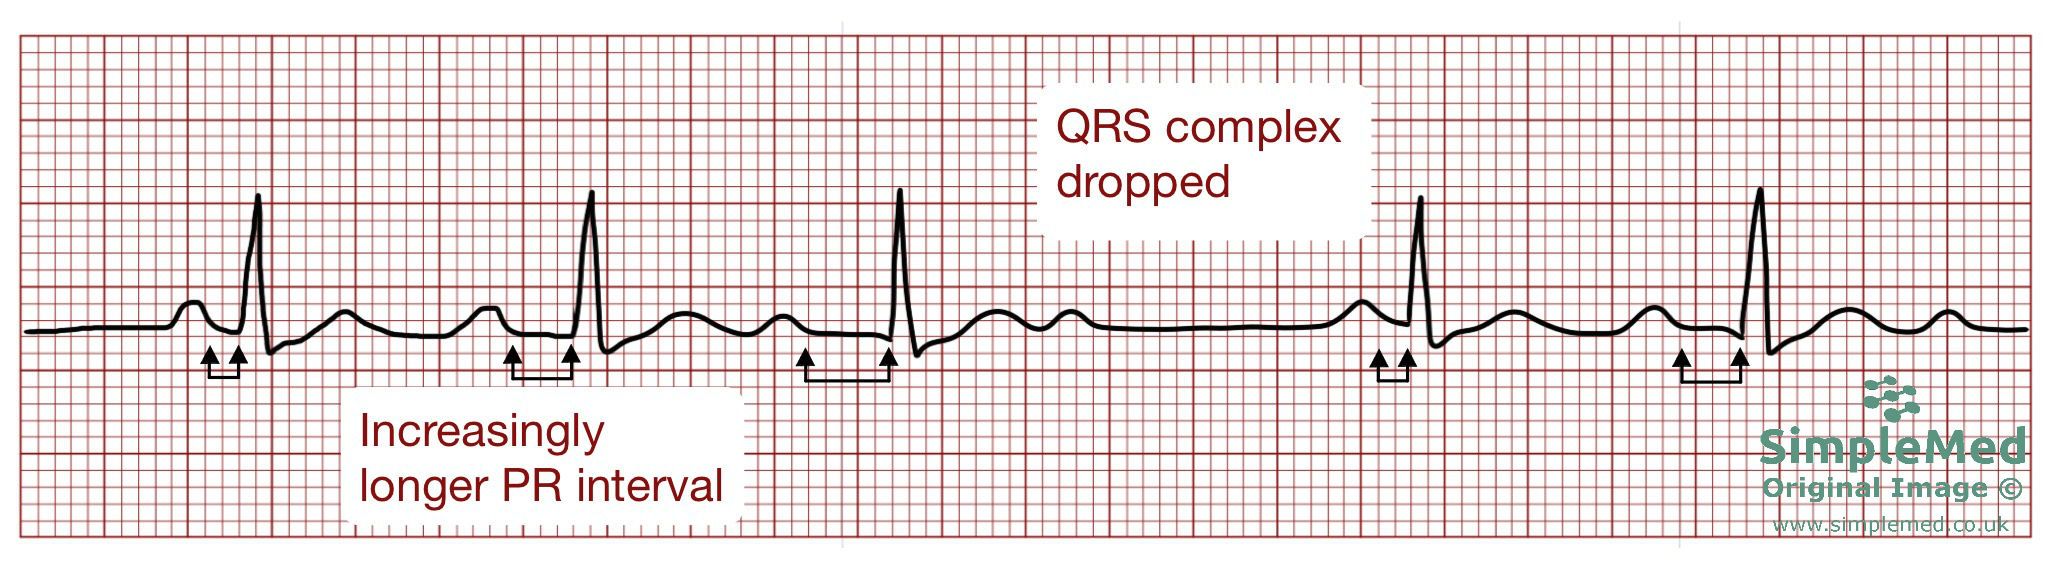
Diagram - Second Degree AV Block, Mobitz Type 1 on an ECG
SimpleMed original by Dr. Bethany Turner
- Mobitz type II - the PR interval is normal and constant, but occasionally the P wave is not conducted so a QRS complex is dropped. This type of second degree heart block is dangerous as it has a higher chance of progression to third degree heart block.
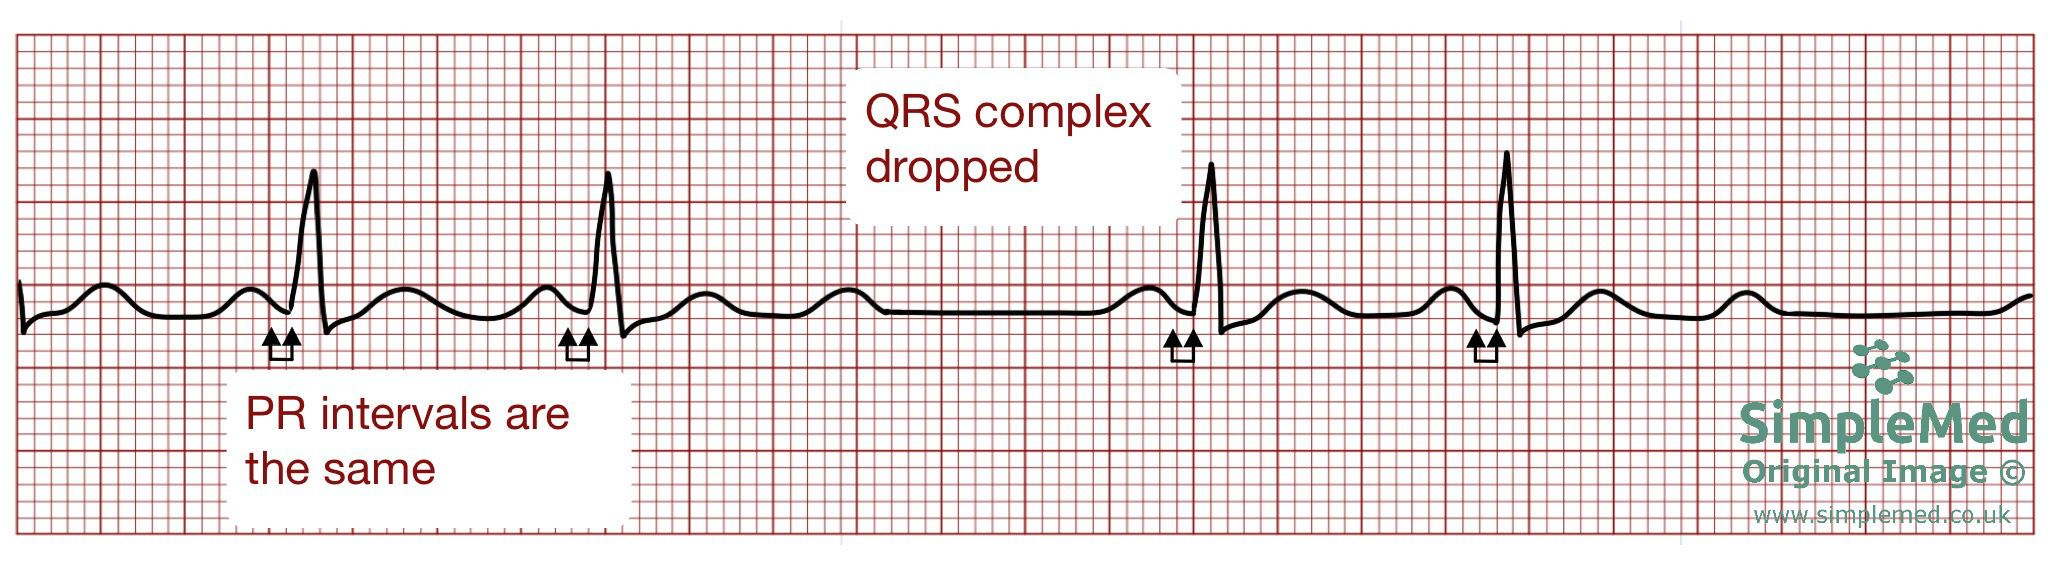
Diagram - Second Degree AV Block, Mobitz Type II on an ECG
SimpleMed original by Dr. Bethany Turner
Another type of second degree AV block where alternate P waves are not conducted. This is a kind of second degree heart block in itself because it cannot be categorised into Mobitz type I or II. It cannot be determined if consecutive PR intervals are the same length or not because there are no consecutive PR intervals.
Third degree AV block is when there is no impulse transmission between the atria and ventricles and therefore they work independently. There is no relationship between the P wave and QRS.
The ventricular pacemaker takes over as an escape rhythm. Escape rhythms occur when the conduction system is blocked, and so the ventricles have to manage themselves and become their own pacemaker. The QRS complex becomes wider because the impulse isn't travelling via the His-Purkinje system. The rate of the ventricular pacemaker is slow and the blood pressure cannot be maintained so a proper pacemaker is urgently required for patients with third degree heart block.
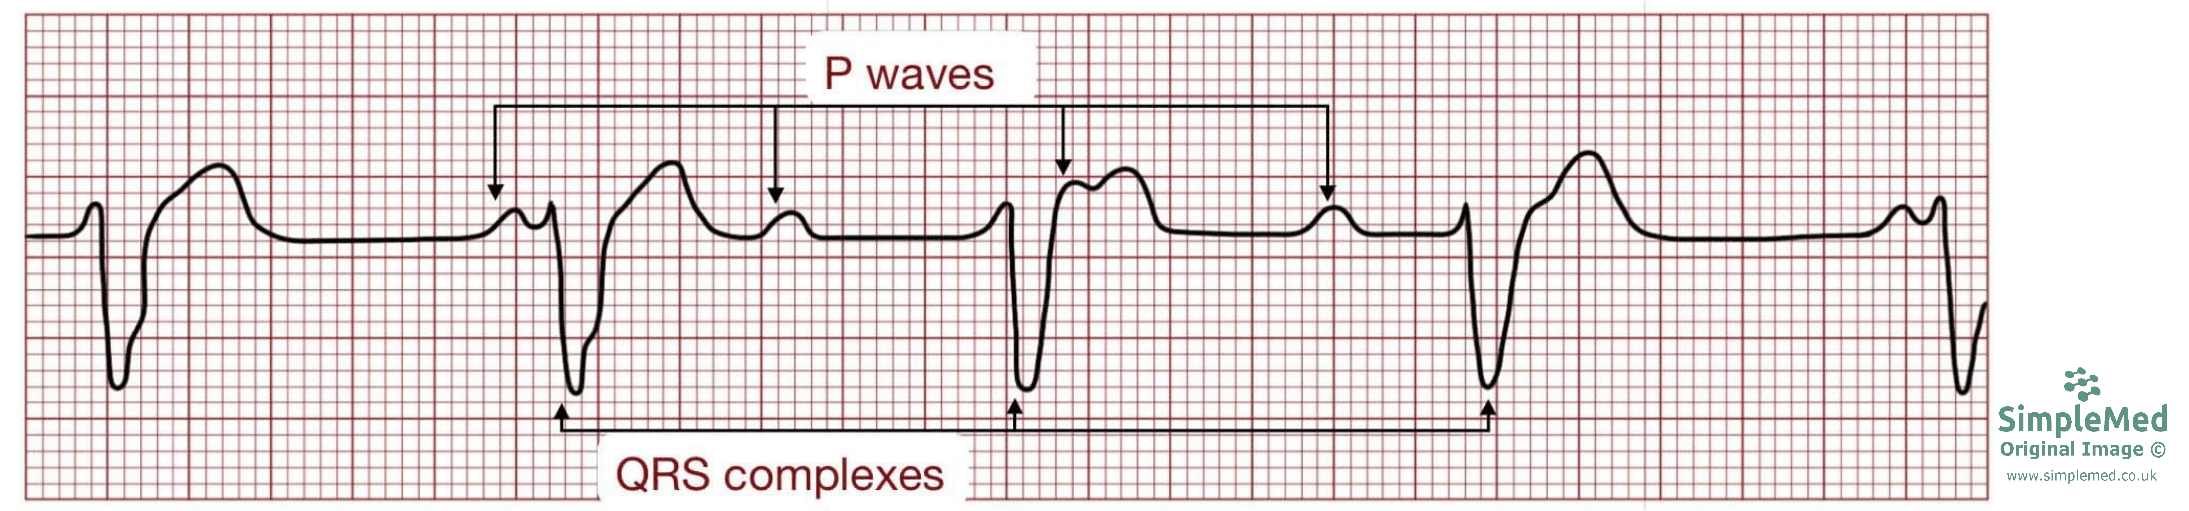
Diagram - Third Degree AV Block on an ECG
SimpleMed original by Dr. Bethany Turner
ST Elevation Myocardial Infarction (STEMI) and Non-ST Elevation Myocardial Infarction (NSTEMI)
STEMI and NSTEMI will both be talked about in more detail in the article on Acute Coronary Syndromes.
A STEMI is an acute myocardial infarction presenting with a characteristic ST-elevation pattern on the ECG. It often reflects acute coronary occlusion and requires urgent assessment for reperfusion. The ECG label does not prove full-thickness necrosis: the final depth of injury depends on factors including duration of ischaemia, collateral flow and treatment.
For a person presenting with acute STEMI, assess eligibility for coronary reperfusion immediately and deliver reperfusion as quickly as possible if they are eligible. These actions are guided by NICE NG185, recommendations 1.1.1 and 1.1.3; they do not depend on waiting for later Q-wave evolution.
The following describes one possible ECG evolution, not a sequence every STEMI follows. Q waves may be absent, and the timing and persistence of ST-T changes vary. Troponin is assessed using serial measurements and the local assay pathway; treatment should not wait for a predetermined ECG sequence.
- Acutely there is an ST elevation and the T wave becomes taller - hyperacute T wave.
- Over time a pathological Q wave may develop. The R wave decreases in height and the ST elevation is still present.
- Pathological Q waves must be distinguished from small physiological septal q waves. Assess their duration and depth in the specific leads showing them, alongside the rest of the ECG and the clinical findings; a single size rule applied to every lead is insufficient.
- The pathological Q wave is denoted with a capital Q rather than the normal small q as the wave is larger than normal.
- Troponin I or T may rise within hours, with the timing of detection depending on the assay and presentation. Serial results are interpreted alongside symptoms and ECG findings.
- T wave inversion may appear during evolution, and a developing Q wave may deepen.
- ST elevation often decreases as the infarct evolves; T wave inversion may persist.
- Later, ST and T wave changes may improve. A Q wave can persist, and R wave height may remain reduced, but these findings are variable.
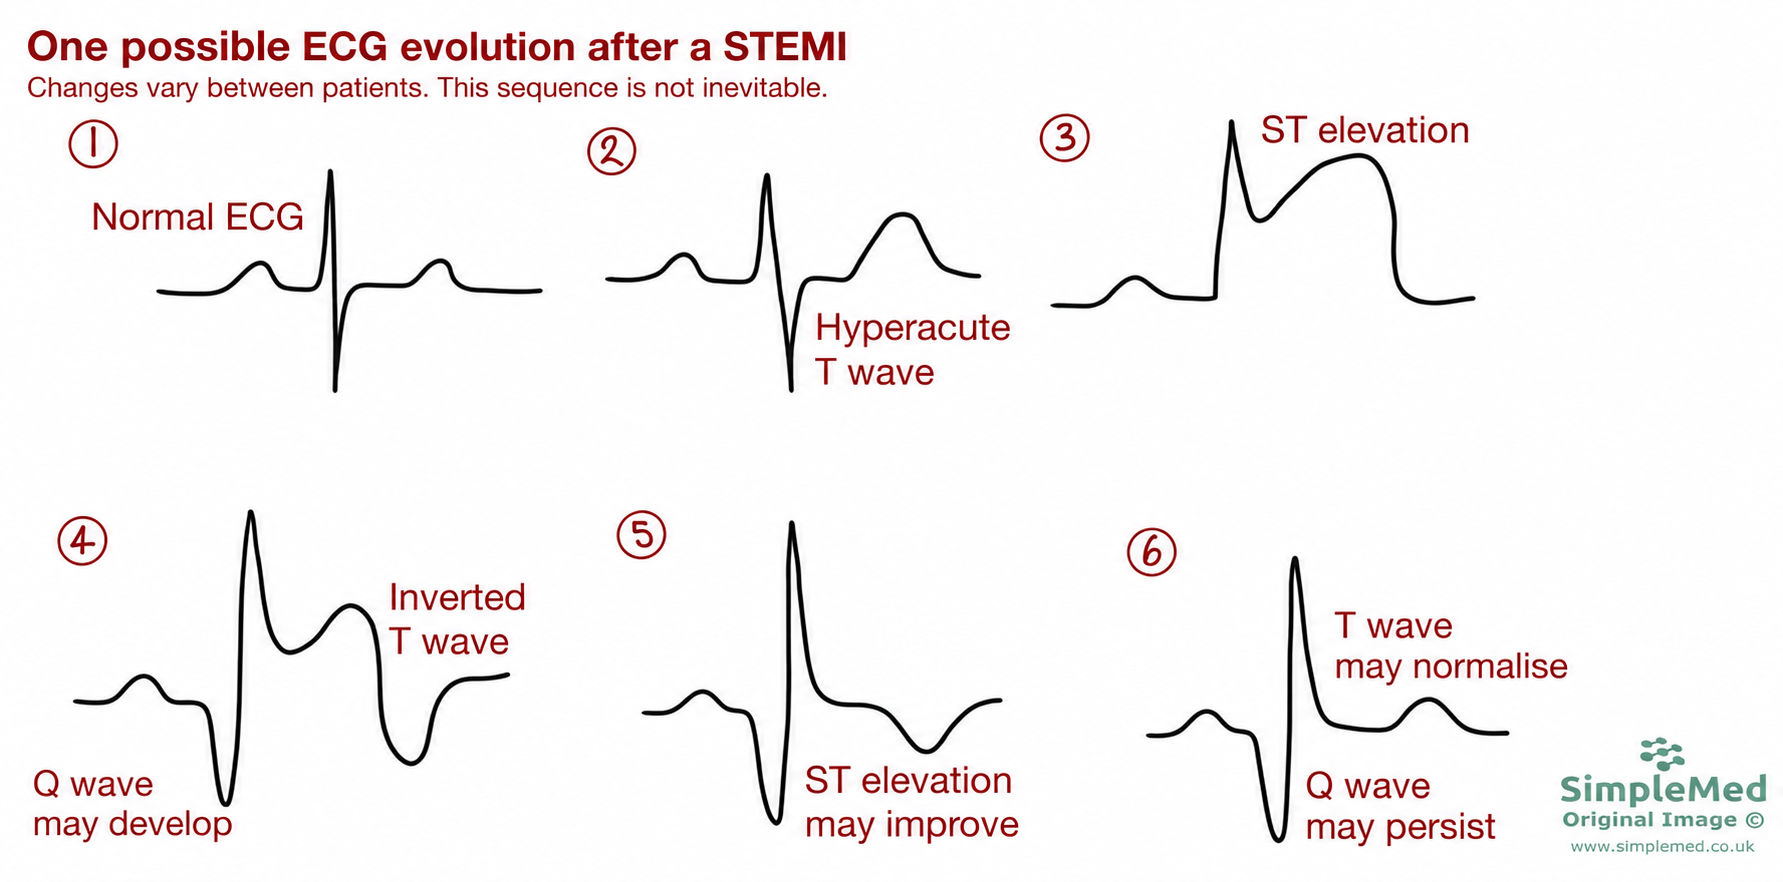
Diagram - One possible ECG evolution after a STEMI. The sequence varies between patients: Q waves may develop or persist, ST elevation may improve, and T waves may normalise. These changes do not establish the depth of the infarct.
Adapted from the SimpleMed original by Dr. Bethany Turner; revised diagram, 1 October 2026.
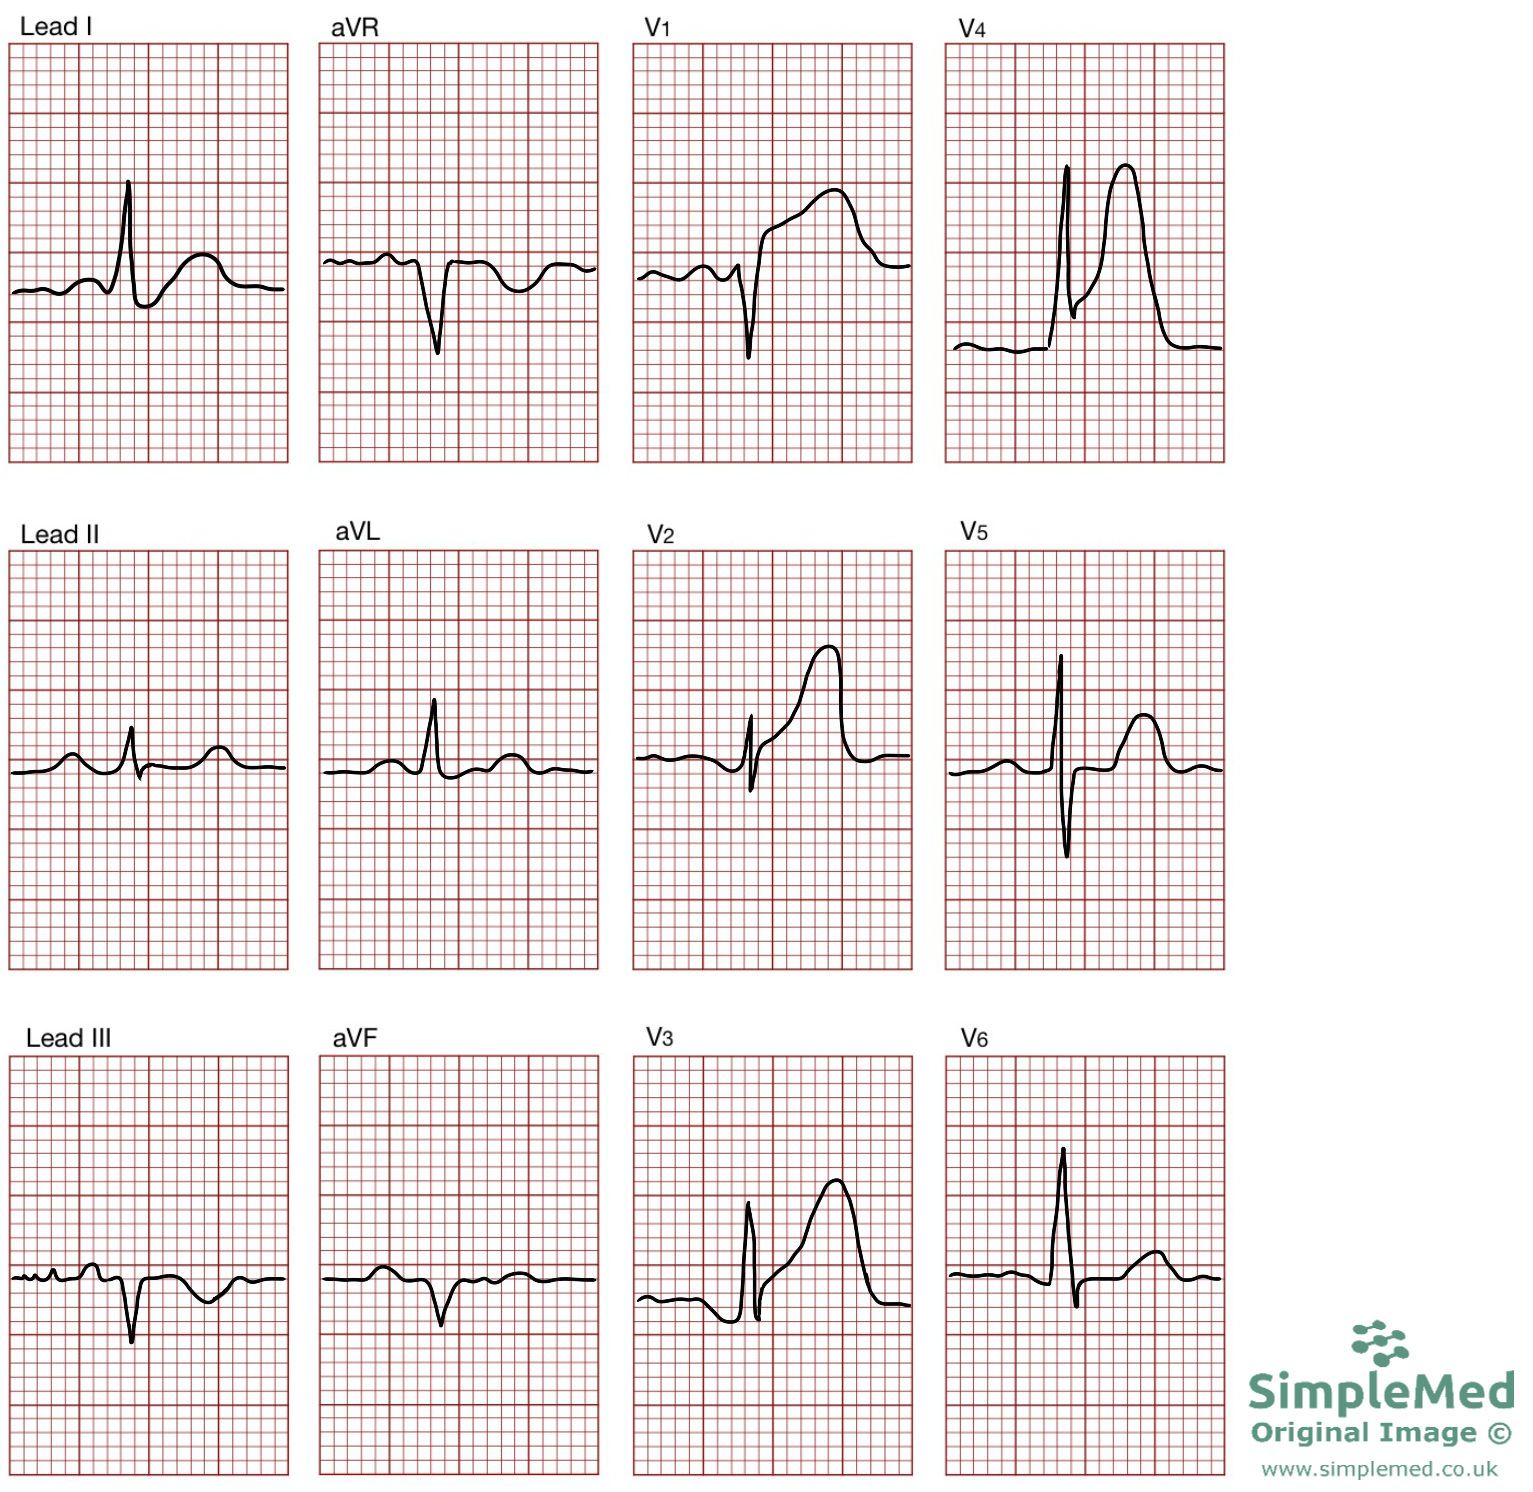
Diagram - A 12-lead ECG of an anteroseptal STEMI. This is shown by the ST elevation and the hyperacute T wave in leads V1-V4
SimpleMed original by Dr. Bethany Turner
An NSTEMI is an acute myocardial infarction without the characteristic persistent ST-elevation pattern. Diagnosis requires evidence of acute myocardial injury, usually a rise or fall in troponin, together with evidence of ischaemia. It is not defined as a partial-thickness infarct, and a completely occluded artery may still be present. ST depression or T wave inversion may occur, but a normal ECG does not exclude an acute coronary syndrome.
- The ECG may show a depressed ST segment, an inverted T wave, both changes or neither. Serial ECGs are useful when the first tracing is non-diagnostic.
- Within hours there is raised troponin I and T on a blood test (indicating myocyte death).
- ST-segment and T-wave changes may resolve or persist; their evolution is variable and is not a fixed timetable.
- Pathological Q waves may develop after an infarct, but their presence or absence does not reliably distinguish transmural from subendocardial injury. Q waves are not obligatory in STEMI and cannot be ruled out solely because an infarct is classified as NSTEMI.
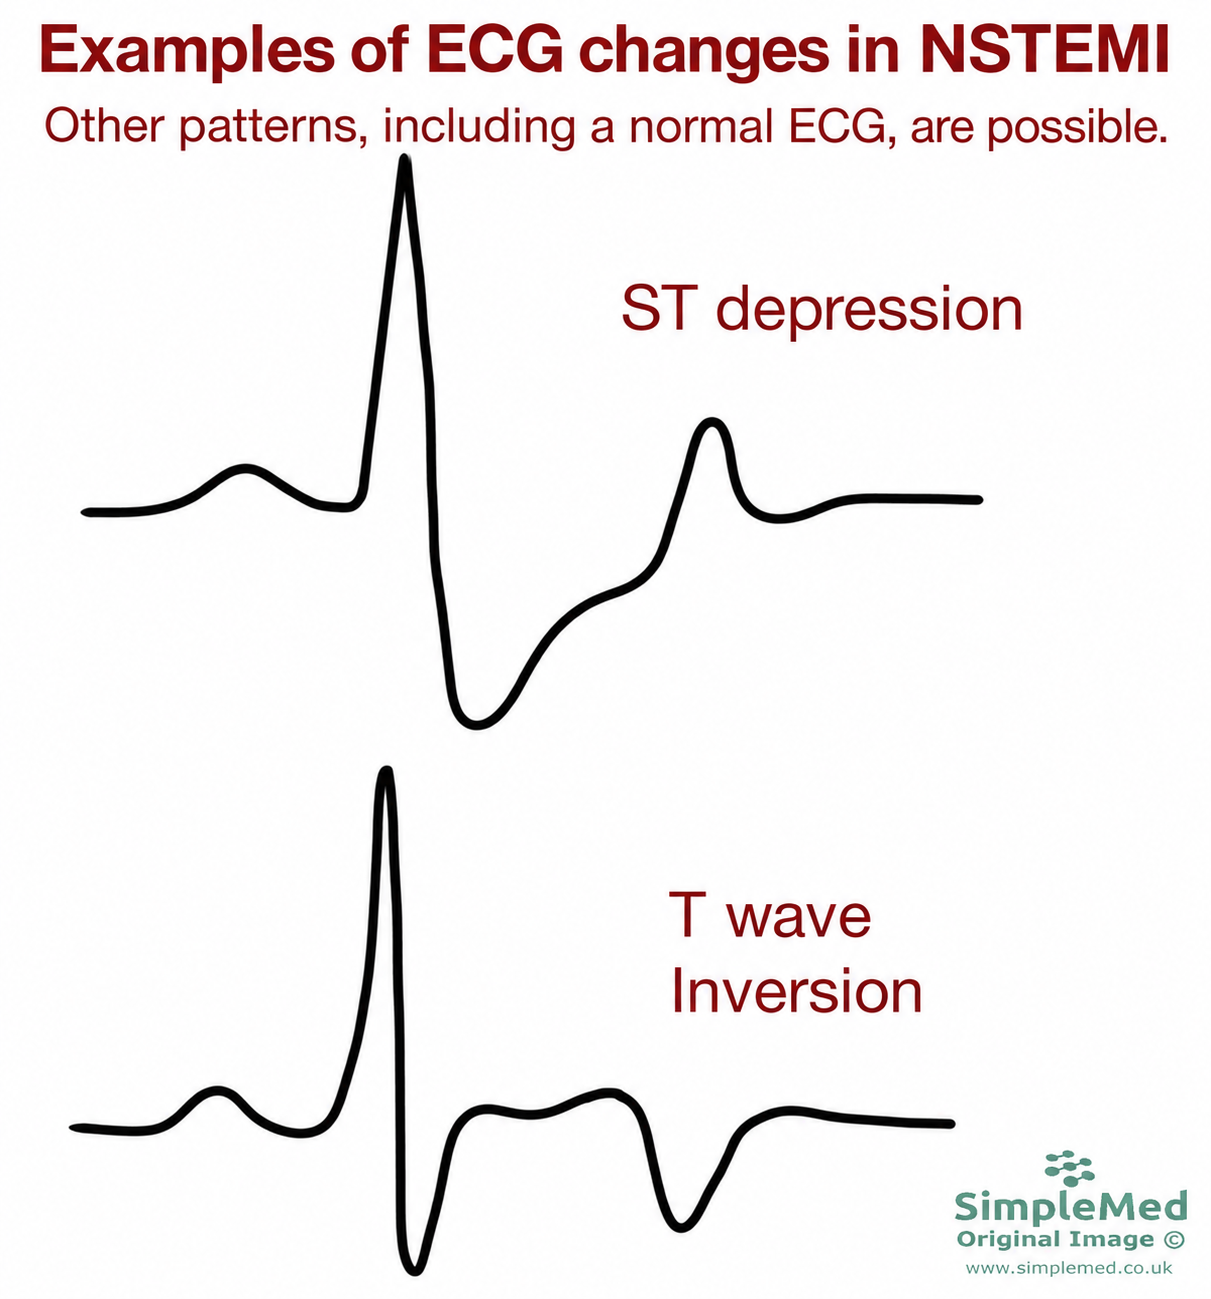
Diagram - Examples of ST depression and T wave inversion in NSTEMI. Other ECG patterns, including a normal tracing, are possible. The diagnosis also requires clinical assessment and evidence of acute myocardial injury; these patterns do not establish infarct depth.
Adapted from the SimpleMed original by Dr. Bethany Turner; revised diagram, 1 October 2026.
Hyperkalaemia makes the resting membrane potential less negative, depolarising it a little. This inactivates some voltage-gated sodium channels so there is a slower upstroke of the ventricular action potential and slowed cardiac conduction, predisposing to arrhythmias.
In hyperkalaemia, the ECG seen will depend on the potassium concentration in the plasma. All values below relate to an approximate plasma [K+].
- 6.0 mmol/L - tall, peaked T wave.
- 7.5 mmol/L - tall, peaked T wave, flattened P wave and a prolonged PR interval.
- 8.5 mmol/L - tall, peaked T wave, absent P wave and a widened QRS.
- 9.0 mmol/L - widened QRS. The ST segment merges with the T wave causing a sine-wave pattern.
Causes include: reduced renal function, metabolic acidosis, cell lysis (e.g. due to crush injury).
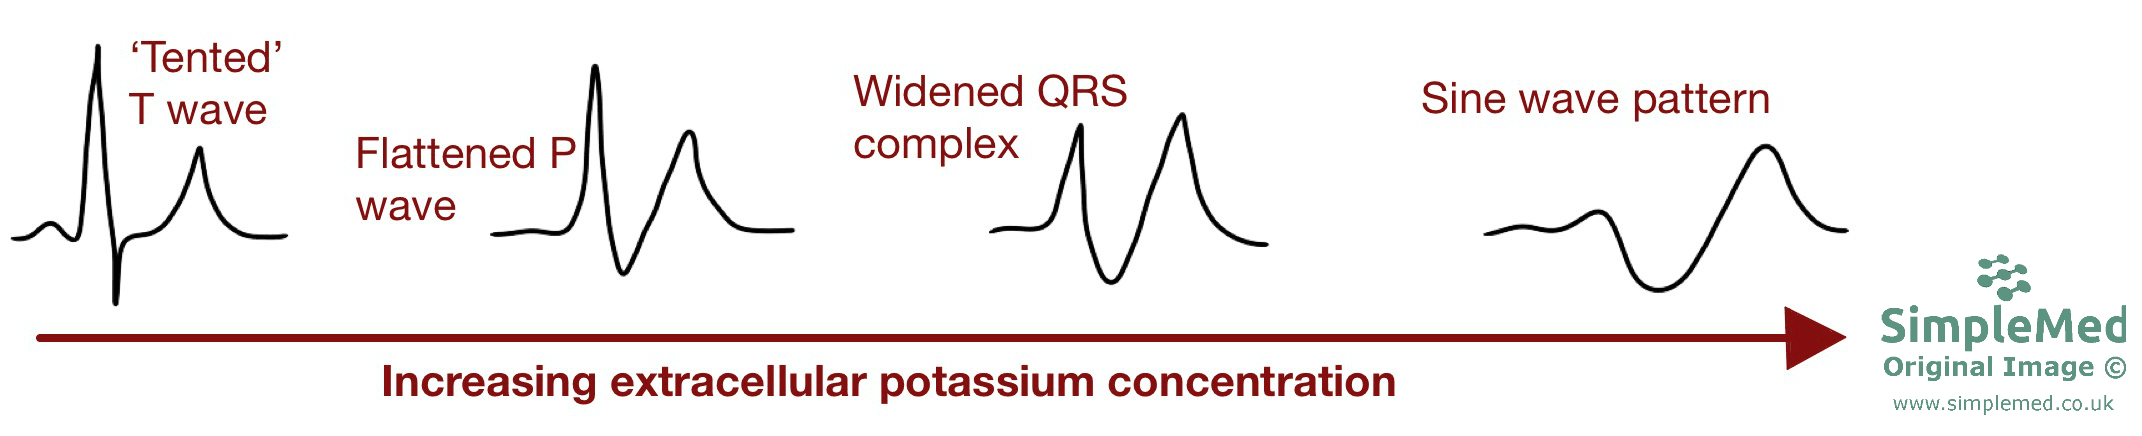
Diagram -The changes seen in hyperkalaemia on an ECG
SimpleMed original by Dr. Bethany Turner
Hypokalaemia is a plasma potassium concentration below 3.5 mmol/L. It results in a lengthened ventricular action potential and delays repolarisation. Longer action potentials can lead to early after-depolarisations causing oscillations in the membrane potential. This increases the risk of ventricular arrhythmias, including ventricular tachycardia or fibrillation.
As the level of potassium in the plasma decreases, its appearance on an ECG changes:
- First there is a low T wave.
- Then there is a low T wave and high U wave.
- Finally, there is a low T wave, high U wave and a low ST segment.
Causes include: severe diarrhoea and vomiting, metabolic alkalosis, high urine output (e.g. in diabetes or with osmotic diuretics).
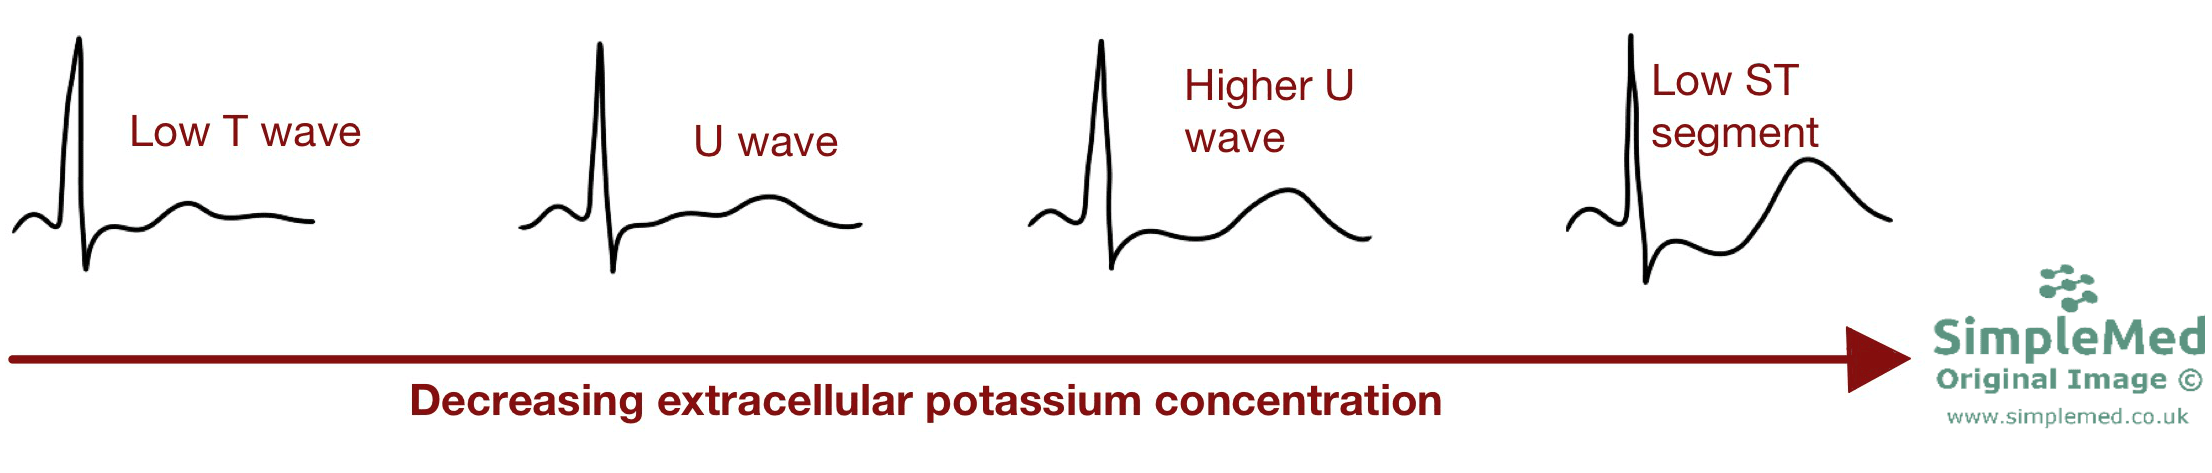
Diagram - The changes seen in hypokalaemia on an ECG
SimpleMed original by Dr. Bethany Turner
Delayed afterdepolarisation (DAD)
DAD is when the membrane depolarises (without stimulation) soon after repolarisation following a contraction. This is more likely if there is a high intracellular calcium as this can trigger contractions when there shouldn’t be one. The depolarisation can reach threshold potential, initiating an action potential, causing the heart to contract.
Early afterdepolarisation (EAD)
EAD is when the membrane depolarises (without stimulation) during repolarisation following a contraction. This is more likely to occur if there is a long QT interval as the action potential is longer. Consecutive EADs lead to oscillations in the membrane potential which can result in VF.
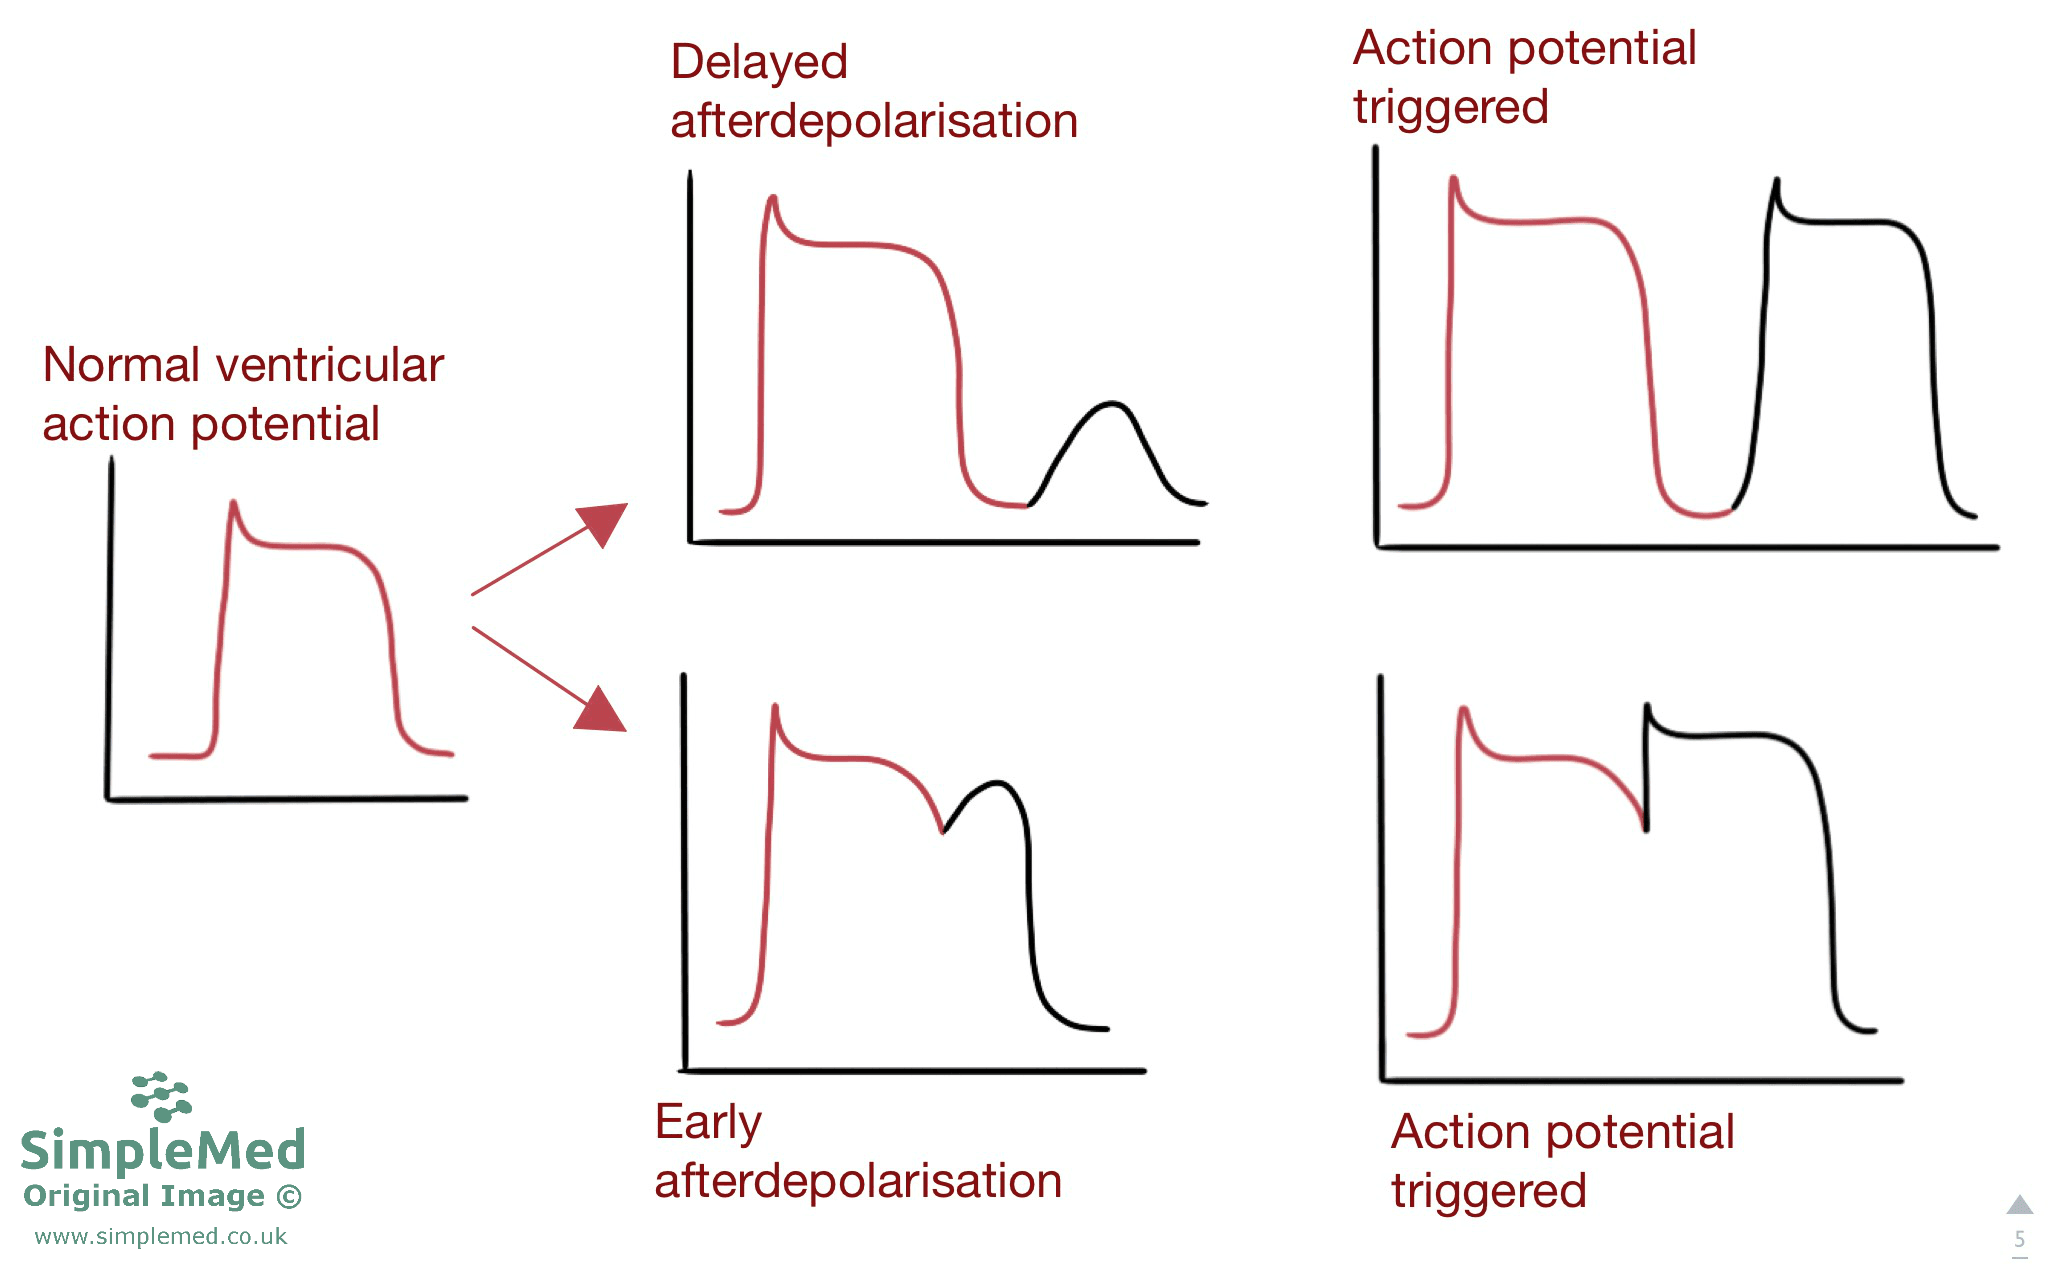
Diagram - The changes in an ECG in delayed and early afterdepolarisations
SimpleMed original by Dr. Bethany Turner
Edited by: Dr. Ben Appleby
Reviewed by: Dr. Marcus Judge
- 33898